Django Heroku Tutorial Series:
- Heroku vs AWS Which is Best for Your Django project
- How to deploy Django project to Heroku using Docker
- How to deploy Python project to Heroku in Gitlab CI
- How to use Heroku Pipeline
- Heroku Logs Tutorial
- How to monitor Heroku Postgres using heroku-pg-extras
Django Dokku Tutorial Series:
Introduction
Heroku's logging feature is not the same as traditional Linux server, so I'd like to write a post talking about this feature in more detail.
Basic concepts and workflow
First, I'd like you to have a basic understanding of how Heroku logging process works.
Heroku’s Logplex router is responsible for collating and distributing the log entries generated by your app and other components of the Heroku platform

As you can see, if you use Heroku CLI to check the log, then can see logs from many different sources.
Heroku logs command
Heroku CLI has command to help you quickly check the Heroku logs.
USAGE
  $ heroku logs

OPTIONS
  -a, --app=app        (required) app to run command against

  -d, --dyno=dyno      only show output from this dyno type (such as "web" or
                       "worker")

  -n, --num=num        number of lines to display

  -r, --remote=remote  git remote of app to use

  -s, --source=source  only show output from this source (such as "app" or
                       "heroku")

  -t, --tail           continually stream logs

  --force-colors       force use of colors (even on non-tty output)
Since the log come from different sourcee, when using heroku logs command, you can add some options to filter the logs.
# display logs for web dyno
$ heroku logs -d web -a heroku-app

# display logs for redis
$ heroku logs -d heroku-redis -a heroku-app

# display logs come from app
$ heroku logs --source app
You can also add -t to see realtime log just like this.
$ heroku logs -a heroku-app -t
Heroku logs look like this
DATATIME app[heroku-redis]: blah blah blah
DATATIME app[web.1]: blah blah blah
DATATIME heroku[router] blah blah blah
So the log format is something like this {datetime} {source}[{dyno}]: blah blah blah, so -d and -s can help you filter logs in good way.
Error log with Sentry
Since Heroku logs do not to do store job (it works like streaming service), so here I'd like to give you a way to do error logging.
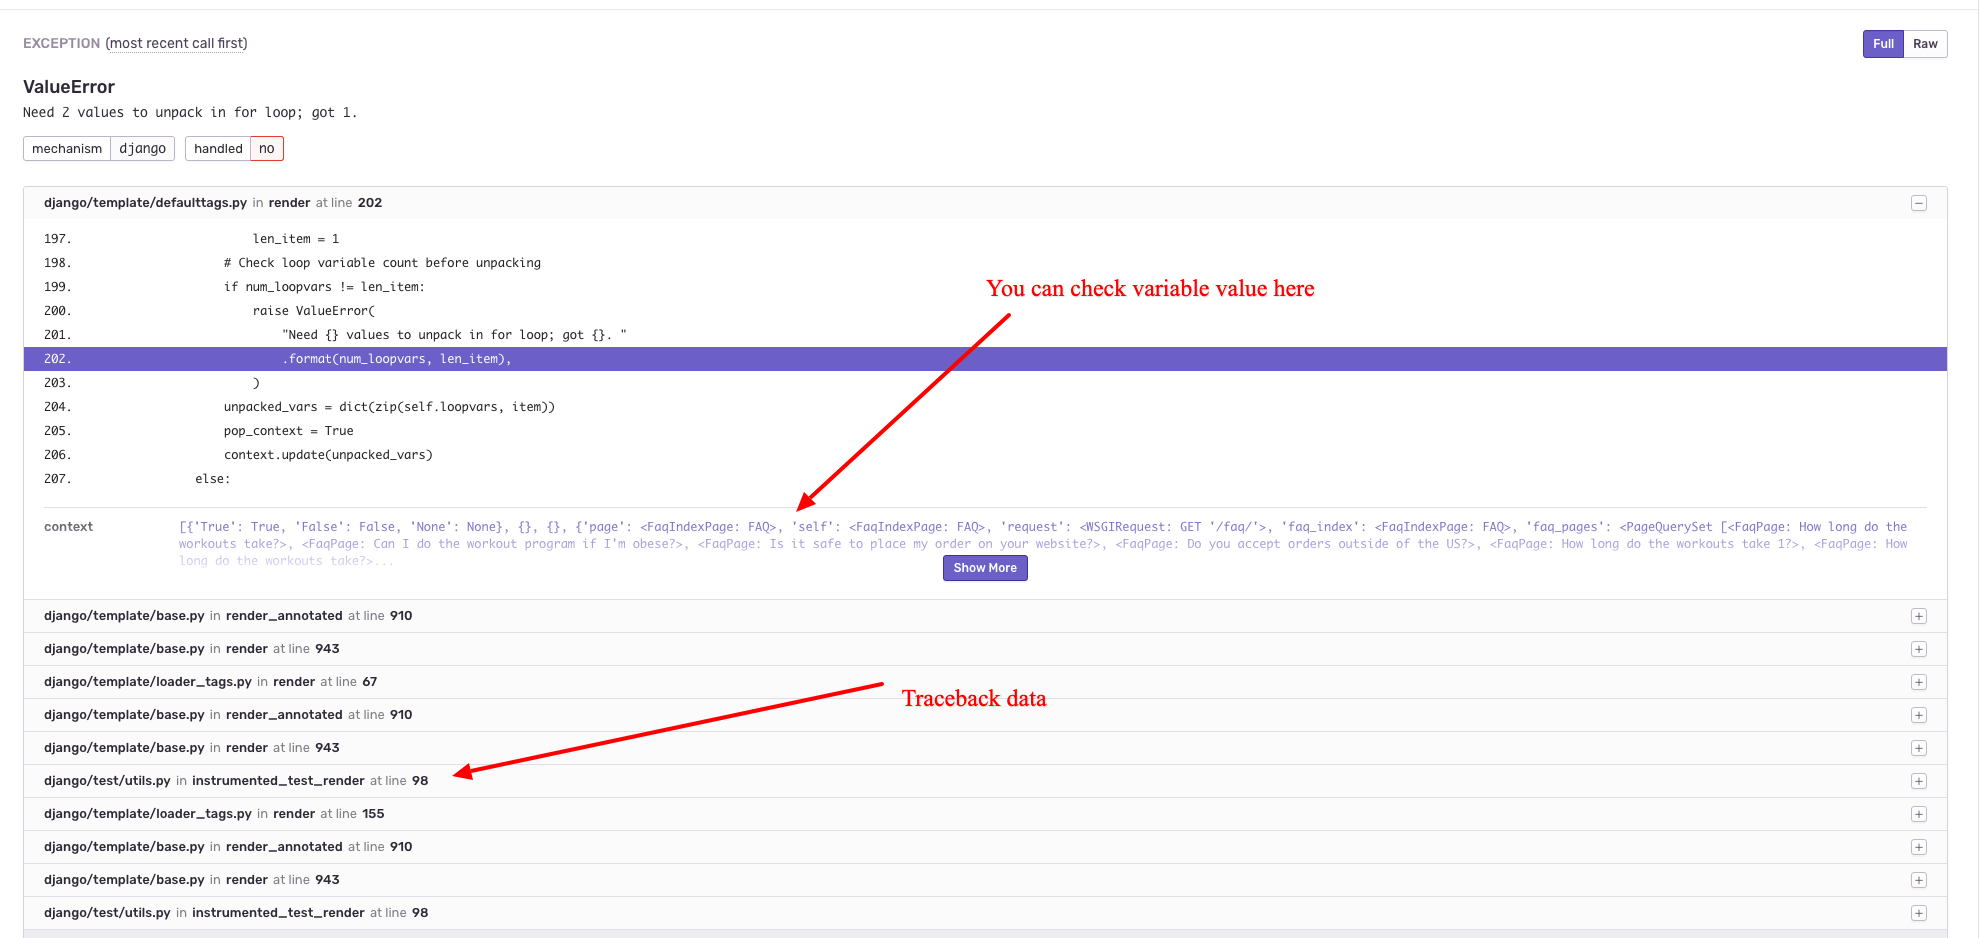
Heroku has plugin called Sentry to help you do error logging, it would catch error, save the error trackback data, and send you email notification. The free plan is good to go for most projects.
- You need to add the add-on for your Heroku app (you can do that in web page or terminal command
heroku addons:create sentry) - After you add the add-on, a new config variable
SENTRY_DSNwould be adeed, just check usingheroku config - Then you need to add Sentry code to your project. (you can get the code on sentry homepage)
For, example, if you want to use Sentry with Django project.
pip install sentry-sdk
Add code below to your Django settings file
import sentry_sdk
import os

from sentry_sdk.integrations.django import DjangoIntegration

sentry_sdk.init(
    dsn=os.environ.get('SENTRY_DSN'),
    integrations=[DjangoIntegration()]
)
Sentry would help you aggregate the error logging and traceback data, it would also send you email error report. So you might not need to Heroku log to troubleshoot some error.

Logging Persistence
Since Heroku log work like stream service and it would not save it for you (you can only get the latest 1500 lines), so if you want to save the log to somewhere, there are some ways to do that.
- Use some add-on, I would recommend
logentries, which also have free plan for you to get started. - Another way is to implement custom
log drains, please check Heroku doc for more details.
Django Heroku Tutorial Series:
- Heroku vs AWS Which is Best for Your Django project
- How to deploy Django project to Heroku using Docker
- How to deploy Python project to Heroku in Gitlab CI
- How to use Heroku Pipeline
- Heroku Logs Tutorial
- How to monitor Heroku Postgres using heroku-pg-extras
Django Dokku Tutorial Series:

